Article • 5 min read
Zendesk Dashboards make data work for you
Zendesk dashboards help you visualise your data for valuable insights. Find out how they can help improve your customer service and grow your business.
By Leighton Jacobs
Last updated May 15, 2023
A data-driven approach to decision-making helps businesses make the right decisions. But understanding your data can be an uphill struggle. With so many data points and metrics, it can be hard to visualise everything–and even harder to draw meaningful insights.
But fear not, Zendesk dashboards have got you covered. Whether you want to see which products are selling like hotcakes or check how many calls your support agents are handling right now, we’ve got a dashboard to help. So, join us on a quick whistle-stop tour of the Zendesk dashboards and find out how they can help you improve your customer support.
Zendesk Explore comes with seven prebuilt dashboards, each with different features, metrics, and filters to help you better visualise your data. From highlighting great CSAT scores to identifying bottlenecks, these seven dashboards can keep an eye on all your important KPIs. Let’s take a closer look at each.
Zendesk Support
This dashboard is all about tickets. It’s your first port of call for tracking the performance of your customer support team and keeping things running smoothly.
Data like ticket numbers, resolution rates, and average response times help you build a quick picture of what’s going on. And metrics like first reply time provide real insight into the quality of your support, helping you spot ways to boost customer satisfaction.

Zendesk Talk

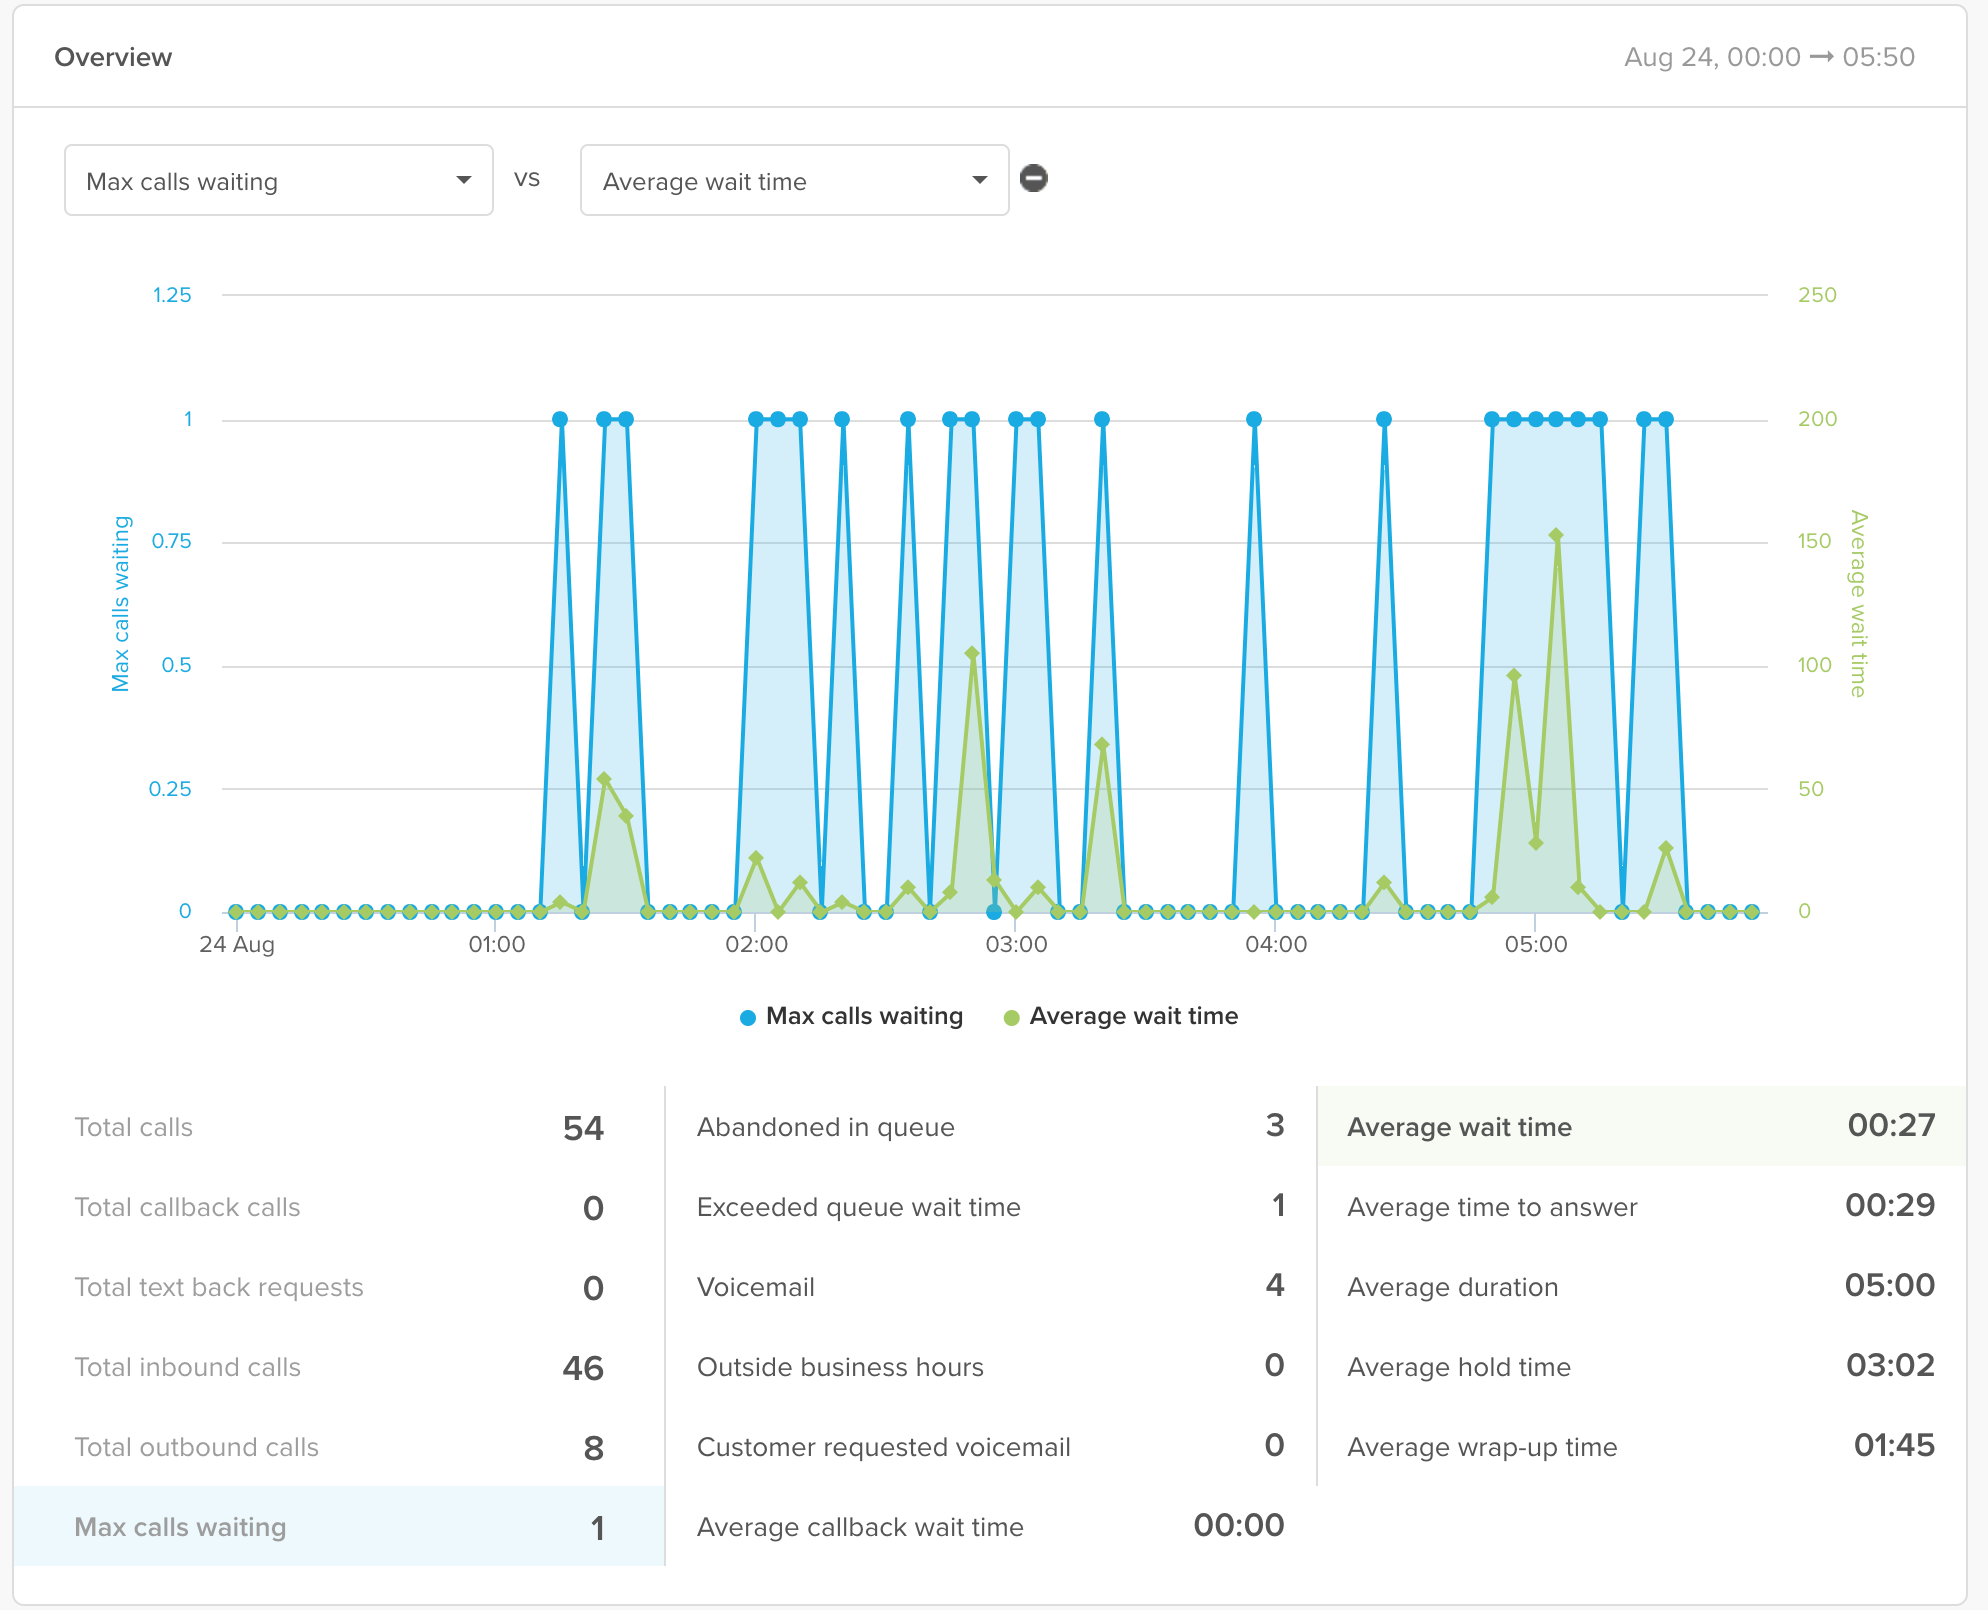
The Zendesk Talk dashboard is a must-have for call centres and phone support teams because analytics like average wait time can help you understand your team’s performance.
It’s quick and easy to see which agents are handling the most calls and who should get the prize for the shortest wait time. This can help keep teams motivated and focused by recognising key achievements and making targeted improvements
Zendesk Guide
This dashboard focuses on your knowledge base, helping keep it accurate and up to date. What’s more though, it also allows you to keep tabs on how your teams are collaborating on content and what’s happening in your community, e.g. number of posts and comments.
It’s full of valuable information such as views, search numbers, and which articles customers are finding most helpful. And reports can provide all kinds of insights, e.g. the relationship between search volume and ticket creation or where you can improve your self-service.

Zendesk Chat

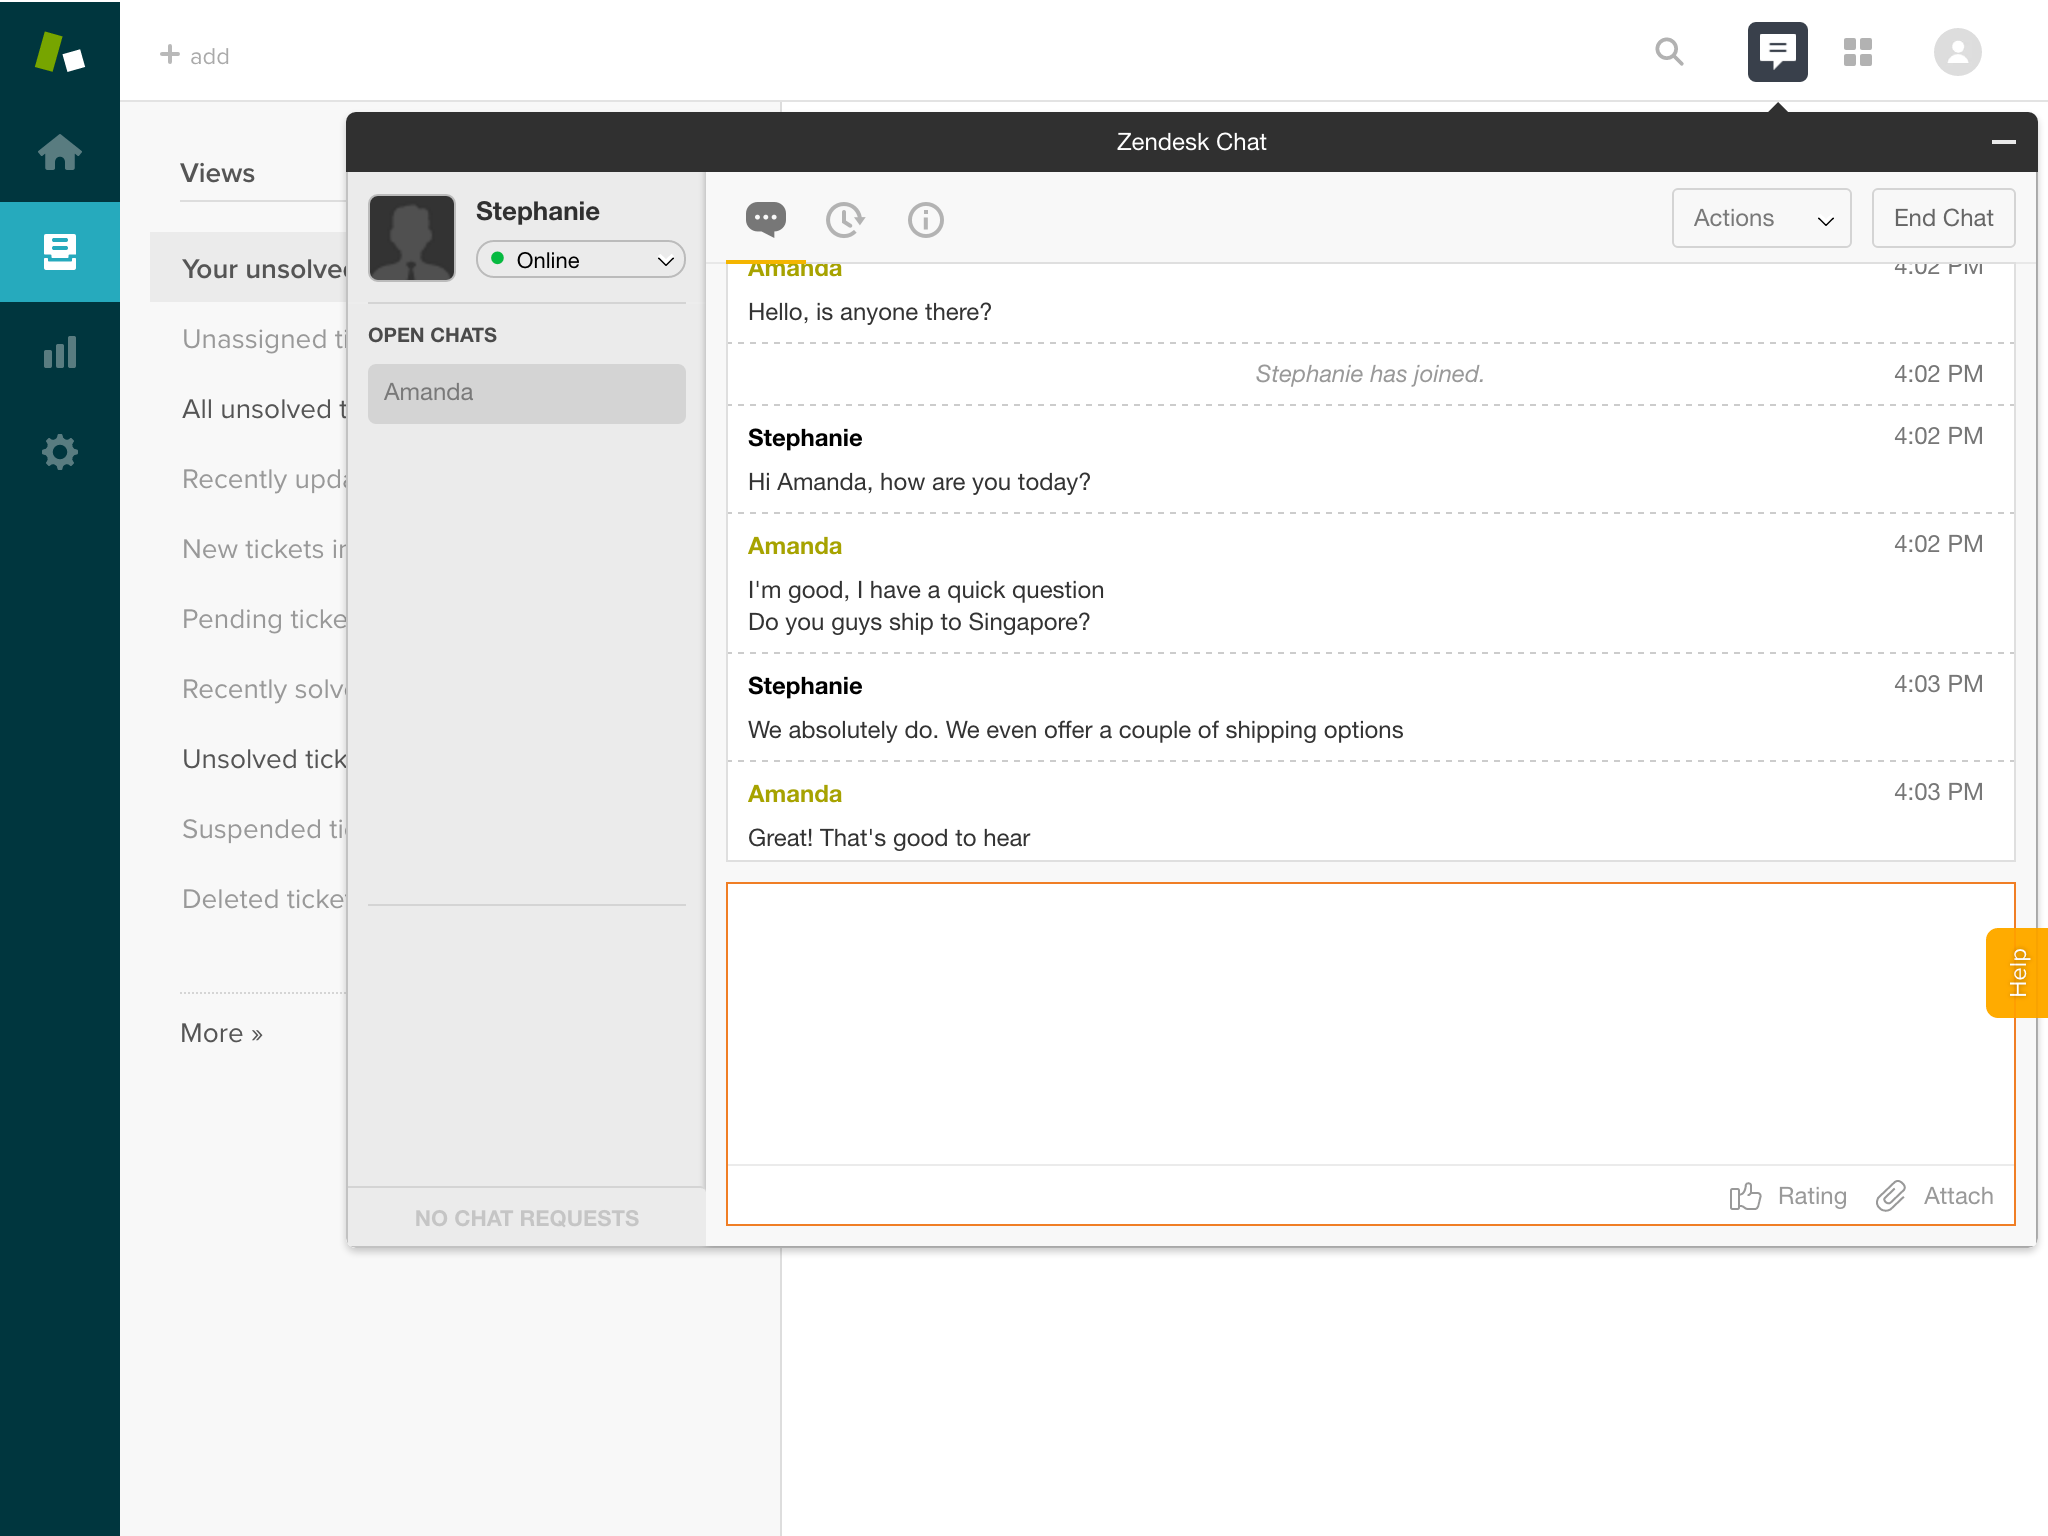
This dashboard lets you see how your live chat is performing. It’s got all the data you need to improve your live chat experience and keep customers happy.
Metrics like chat volume, chat duration, and average reply time provide important insights into your chat support. But you can also see which agents are handling the most chats and who’s resolving them the quickest–essential information for management. And customer satisfaction scores for each chat session make it easy to improve your customer experience.
Zendesk Sell
This is our sales dashboard, which tracks the performance of your sales team. It allows you to see almost everything from outgoing email volumes to how many products you’ve sold.
Vital insights on deals, leads, and close rates help you pick up on new trends and develop new marketing strategies. And sales analytics can even reveal shortcomings in workflows. Remember: dashboard visuals are also perfect for compelling presentations and reports.
Zendesk Answer Bot

This is the place for all things Answer Bot–an important piece of your customer service puzzle. Answer Bot working at its best will keep customers coming back for more.
It can show you how many times Answer Bot has been used, how many questions it answered, and what the average response time was. And indicators like click-through rate help you understand how well Answer Bot has done at recommending articles.
Live dashboard
The Live dashboard is where you can find near real-time data about your Zendesk products. Real-time data can help you work more efficiently and make quick adjustments.
The Live dashboard helps you visualise data for Chat, Talk, and Support with metrics like open tickets, calls in queue, and active chats. This gives you a better idea of exactly what’s going on at any given moment and can help you spot signs of potential problems.

Custom dashboards
If you don’t see exactly what you’re looking for in the prebuilt dashboards, fear not because custom dashboards have got you covered. Check out the Zendesk Marketplace for a whole host of great apps like Agent Dashboard that you can quickly integrate into your business.
And if you still don’t find what you need, you can always create your own custom dashboards to suit your specific needs and track any data you like. Zendesk’s drag-and-drop interface makes it easy to add any widgets you need.
Here’s how to create your very own custom dashboard in four simple steps:
Create your dashboard: create a new, empty dashboard in the Report builder or dashboards library.
Choose your data: add the data you want using widgets, e.g. reports, filters, text, etc. that will help save time and improve your customer service.
Make it your own: customise your dashboard with unique colours, formatting, interaction options, and more. Resize, move, and copy your widget to suit your needs.
Share your dashboard: share your new dashboard with other people on your team so they can start using it, e.g. to create custom reports for your business.
Zendesk dashboards are valuable tools for any business because they help you understand what you’re doing right and where you need to improve.
Prebuilt and custom dashboards allow you to make data-driven decisions by providing insights into every aspect of your business, from customer support to sales. In other words, they get rid of the guesswork so you can reach your customer service goals.
