Sales dashboard full guide: examples, templates & KPIs
Build a smarter, more profitable sales team with a personalized sales dashboard.
Last updated August 20, 2025
Sales dashboard: a full guide
In business, everyone has goals. But constantly updating your stats and numbers in relation to those objectives can be time-consuming. A sales dashboard is a feature of many sales apps that gives you access to up-to-date, actionable sales data.
With it, you’ll know exactly how close you are to your current goals. And where it may be necessary to tweak your sales strategy.
In this guide, we’ll give you a comprehensive overview of what a sales dashboard is. Along with how to find one that fits your business strategy.
- What is a sales dashboard?
- Why are sales dashboards essential for success?
- What are the benefits of a sales dashboard?
- How do I create a sales dashboard?
- What are some limitations of sales dashboards?
- 10 sales dashboard examples/sales dashboard templates
- Frequently asked questions
- Turn sales insights into customer success
What is a sales dashboard?
A dashboard is a sales app that provides a visual representation of your most recent performance metrics. It gives you a concise view of results-based metrics like sales to date, sales by region, lead conversion rate, sales growth, and so on.
It also lets you track activity-based metrics so you can view calls made, emails sent, and what the average lead response time is.
Dashboards are an essential tool for businesses who want to increase revenue and plan for growth. Without one, you’re left to analyze dizzying amounts of data on your own. Trying to amass all of those sales analytics manually would be an exhausting task, and the end result would most likely contain errors.
A sales dashboard, on the other hand, organizes the most accurate and recent sales-specific metrics into easily understandable visual graphics. This saves you time, and eliminates the possibility of human error.
Who uses sales dashboards?
The primary users of sales dashboards are managers and sales reps. Every day, week, or month, sales teams can check their sales dashboards to view where they stand in relation to their goals and quotas.
Managers get the big-picture view so they can see the sales process as a whole, while reps can focus on their individual performance metrics.
Some sales dashboards can also provide benefits for other teams in your company. Marketing and customer service reps also need to know how sales are performing, so they can align their strategies and perform as a team.
Where do I find sales dashboard software?
The most comprehensive dashboards are typically found as a feature of customer relationship management software — or CRM software. A CRM sales dashboard gives you real-time sales data, as well as a host of other features for optimizing customer relationships.
What is CRM? And why do they have sales dashboards?
Customer relationship management is a tool for building strong relationships with your customers. Part of that relationship is keeping an eye on your sales and product performance.
So you can identify where the problem spots are and jump in to fix them. Your customers don’t care about your sales performance, but they do care about your customer service.
Having a sales dashboard can give you invaluable insight into how your customers are responding, or not responding, to your initiatives. This lets you fine-tune your customer’s path as they move through your pipeline, helping you deliver stellar service to happier customers. For that reason, it's often a feature of sales pipeline software.
Can I manually create a dashboard in Excel or similar system?
You can manually track your sales number if you have the time. But to keep that data up-to-date and accurate would require a huge amount of labor and attention. If your data isn’t recent and accurate, it simply won’t help you in the long run. Only the most up-to-date and correct data will let you make the best decisions to streamline your process.
What metrics can I view using a sales dashboard?
Sales performance dashboards let you view results-based and activity-based metrics. But not every department and team member needs to see every piece of data every day. Sales dashboards can be customized so that you only see what’s relevant to your workflow. Some of the most common metrics included in a sales dashboard are:
- Sales by region
- Sales to date
- Sales per rep
- Average purchase value
- Lead conversion rate
- Sell-through rate
- Quote-to-close
- Opportunities
- Sales target
- Average order value
- Deals in the pipeline
- Follow-up rate
- Lead response time
Again, the metrics your team members see on a daily basis will be up to management. Later we’ll discuss what to include in your sales dashboard, and how to configure it for optimal efficiency.
Why are sales dashboards essential for success?
Success isn’t a destination, it’s a process. Growing profits isn’t just about putting out the best product or service, it’s about understanding what you’re doing right and where you need improvement. Every company should have an organized way of understanding exactly how they’re performing, and where they might be falling short.
Sales dashboards organize your metrics so you can cut out the guesswork and make data-driven decisions. With the hard data organized into easy-to-view graphics, you can make quick adjustments to your sales process. Then see in real-time if they have a positive effect.
Dashboards also provide an accessible view of your sales history so you can identify trends and patterns. You have past and current sales figures at your fingertips. So you can gain a better view of what tactics are working and how you can further improve your figures in the future.
What are the benefits of a sales dashboard?
Whatever someone’s task is within your company, having accurate performance metrics close at hand gives them a helpful guide for making informed decisions. Streamlining your sales process is easier when everyone involved has access to easily digestible results-based metrics.
It also gives people an up-to-date view of their KPIs. So they can personally adjust their daily activities to see which practices bring them closer to their goals.
Benefits in sales
Sales reps always have their eyes on the sales target. Seeing their performance organized into simple graphics helps them reach their target. All by showing them exactly where they’re succeeding, and where they need to exert additional effort.
- Better understanding of overall performance: Knowing how the entire company is performing helps the sales department plan initiatives for training, growth, and new sales tactics. Decisions made at the top will make more sense when everyone can see the hard data behind them. It creates a more cohesive work environment where trust is based on the numbers, not someone’s gut instincts.
- Improved alignment with the marketing department: It’s important for the sales department to know how the marketing team’s activities are impacting sales. From the dashboard, they can see how many sales-qualified leads entered the pipeline in any given week, month, or quarter. They can also see which marketing campaigns generated the most sales. Sharing data in this way makes it easier for departments to build integrated strategies for moving more leads through the pipeline. That increases revenue and provides greater insight to which marketing tactics are working.
- Improved view of Individual KPIs: Company-wide targets are great motivators for people at the top. But individual sales people also need motivation to consistently improve their work. From their customized dashboard, sales reps can see how many sales calls they’ve made. And how many deals they’ve closed. And how many proposals they’ve sent out. It goes on. Having that kind of data readily available gives sales reps a clearer understanding of exactly how their daily activities are driving sales. Or slowing them down.
Benefits in marketing
Marketing is the department that brings buyers to the table in the first place. So it’s vital for it to see exactly how their initiatives are driving sales. Sales dashboards help marketers fine tune their campaigns. That brings in better qualified leads, which helps speed along the sales cycle and make room for even more leads to enter the pipeline.
- Customizable access to KPIs: When your marketing team has all of its KPIs in one spot, it’s easier to meet objectives and set future ones. But your marketing team doesn’t need to see all the data at once. That’s why many sales KPI dashboard creators make their platforms customizable. So your marketing team can pick and choose which data points they want to view on a daily, weekly, and monthly basis.
- Improved sharing of data between departments: With a sales dashboard, your teams will no longer have to reach out to each other and ask for data. The marketing team always has access to the most up-to-date sales numbers, meaning there’s less need for back-and-forth emails and requests for information.
- Create better campaigns: With accurate and easy-to-read reports at their fingertips, marketing teams can build campaigns faster and with more confidence. They can see which previous campaigns have attracted the highest value customers. That way they can continue reusing the tactics that work, while abandoning the tactics that don’t.
Benefits for executives
The people at the top need a comprehensive view of everything happening at all levels. Trying to take in all that information in a single glance would be impossible. Dashboards organize company-wide data into easily viewable graphics that your executives can pull up at a moment's notice.
With their eyes on the big picture, executives use sales performance dashboards to keep the company on track to hit long-term goals. Or implement changes and plan for growth.
- Improved internal communications: Using a dashboard lets your executives easily share relevant information across departments and with investors and board members. The data is compiled in one place. Executives no longer have to wonder if the right people have the information they need to handle their individual tasks.
- Save massive amounts of time and labor: Needless to say, manually compiling all of your sales data would be an exhaustive task. Using a dashboard to handle the work frees up hours of labor, letting executives better allocate resources to where they’re most effective. They can also trust that the data is accurate and up-to-date, so they’ll know that everyone is working with the best possible information.
- Create data-driven strategies for driving profits: A successful business is one that can change and grow with trends. Implementing change, either company-wide or on an individual basis, is easier when you have the data to back up your decisions. Your team members understand exactly why they’re being asked to do more training or implement new practices. So they’re less likely to question adjustments.
How do I create a sales dashboard?
Every business that uses a sales dashboard is going to configure it differently based on their unique goals. Before committing to a sales dashboard program, gather some data beforehand to get a well-rounded view of where business currently stands.
Later, we’ll look at some sales dashboard examples and sales dashboard templates. All to help you understand the possibilities of customization and which options may work best for you. If you’re interested in templates, check out our sales forecast template, too.
Choose your metrics
Review your goals and try to determine which metrics will be most useful to your team members in their day-to-day workflow. To do this, ask them some questions about how they currently view their performance:
- How many customers are you currently closing month-to-month?
- What’s the average deal size of the business you’re winning?
- What’s your current win/loss ratio?
Make sure to also discuss both results-based KPIs and activity-based KPIs. It’s like any other big project in life. Being able to break a large goal into smaller ones helps you organize and strategize, making the larger goal easier to reach.
Ask every department to make a list of the metrics they’d like to see on a daily, weekly, and monthly basis. Then label it with its related goal. Then, prioritize that list according to your company’s individual big picture goals. This will help you choose the software that best fits your needs, giving you greater control over which KPIs you’re tracking.
Know your limits
Learning new software can be time-consuming. It’s best to have a realistic idea of what your team’s IT capabilities are. And how much time you can devote to training them on a new platform.
Some dashboards are built to be intuitive, while others may include a steep learning curve. Look for platforms with user-friendly interfaces and a solid support system, with 24/7 live rep support and multiple training options.
Select a dashboard tool
Once you’ve developed a prioritized list of metrics each department would like to see, it’s time to shop around. As stated before, sales dashboards are usually included as a feature of a larger software platform. Sales software programs like CRM and sales trackers often offer a dashboard feature.
Shopping for software can be tricky. It’s hard to know which platform is right for you if you’ve never used a sales performance dashboard before. As you shop around, keep your eye out for CRM platforms that offer free trials. You’ll be able to test drive their dashboard feature. And dip your toes into other functions that can improve your customer relationships.
Once you’ve tested out and decided on the right sales dashboard platform, you’ll have to import your company’s data. If you’re already using a CRM, it should be easy to integrate these two business tools.
If you’re not already using a CRM, however, it may be smart to combine your shopping venture into a twofold strategy. So you can reap more benefits from a single, unified platform.
What should you include in a sales dashboard?
This is entirely up to you and your company’s goals. You may start by believing that more is better; you want as many metrics in your sales report as possible to stay informed. But in reality, a cluttered dashboard isn’t nearly as useful as a carefully constructed one.
Which sales KPIs should you focus on in the sales dashboard?
There are three metrics you should focus on when using a sales KPI dashboard:
- True-north metrics: These metrics give you the best view of the overall health of your company. These are the “big picture” metrics that help you make the most impactful decisions for growth and improvement.
- Activity-based metrics: These numbers reveal how your sales reps are spending their time, and where their efforts are being applied.
- Results-based metrics: These metrics show you the outcome of your efforts. Viewed next to your activity-based metrics, you can see how your activities are paying off, and which efforts aren’t producing the results you’d like.
How do I customize a sales dashboard?
Many CRM platforms and other business apps are built to be customizable. You can filter which reports you see, and how you want your metrics to be displayed. Look for low-code or drag-and-drop options that let you intuitively add and remove information as you see fit.
What are some limitations of sales dashboards?
If it’s starting to sound like a sales dashboard will solve all of your business problems, don’t get too hasty. A sales dashboard is just a tool. It might be able to tell you where your numbers are lagging, but it won’t tell you what to do about it. Using a sales dashboard to your benefit will require having business-savvy team members who know how to interpret the numbers to create actionable solutions.
A sales dashboard will let you know where course-correction is needed. But it won’t tell you how to make that correction. That’s why a lot of businesses decide to get their sales dashboard through a CRM.
A sales CRM platform gives you better insight into customer behavior. Which will help you build strategies for improving the numbers you see on your sales dashboard.
9 sales dashboard examples and templates
There are dozens of ways to configure your dashboards. Check out the sales dashboard templates below. Notice how different providers organize sales analytics, and the metrics they recommend including in those specific views.
1. Sales Rep Dashboard: HubSpot
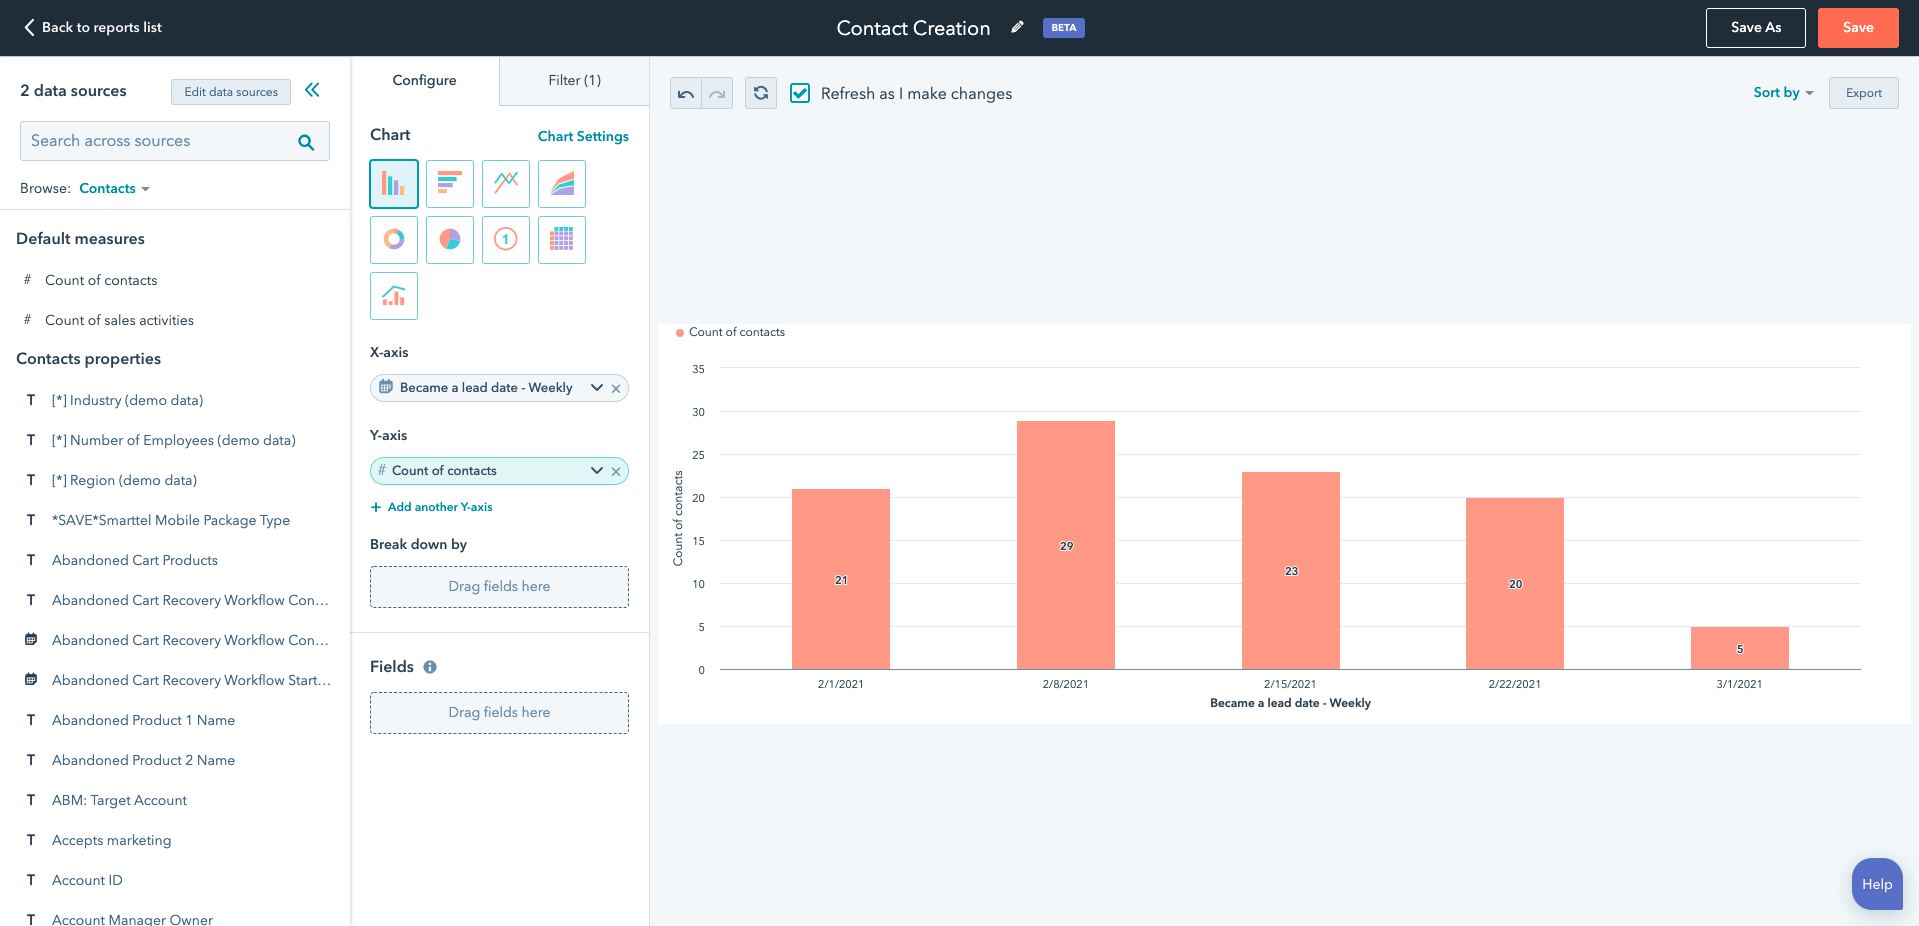
Metrics/widgets:
- Meetings booked
- Open opportunities
- Deals in pipeline
- Forecast
- Sales cycle length
2. Monthly Sales Dashboard: Klipfolio
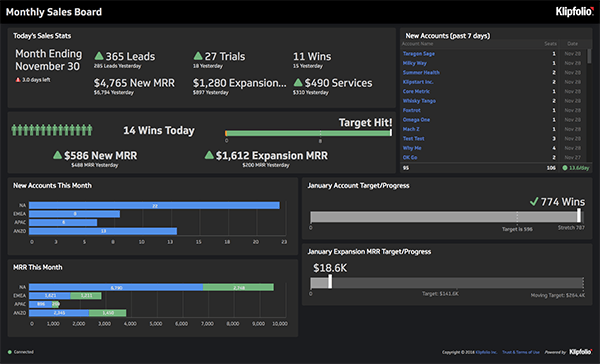
Metrics/widgets:
- Daily wins
- Revenue and wins
- Accounts by country
- Open potentials
- MRR retention/expansion rate
3. Executive Sales Dashboard: Qlik

Metrics/widgets:
- Closed revenue
- Quota achievement
- Sales revenue vs quota trend
- Open sales pipeline
- Top open opportunities
4. Sales Territory Assignments Dashboard: Tableau

Metrics/widgets:
- Territory map
- Account spend
- Lifetime spend
- Prior year spend
- Current year spending
5. Key Performance Indicators Dashboard: ClicData

Metrics/widgets:
- Average impressions
- Average ACoS
- Dollar sales by product
- Sales count by state
- Total sales
6. MRR & Churn Dashboard: Stripe

Metrics/widgets:
- Gross volume
- MRR growth
- Customer churn rate
- Revenue churn
- Customers
7. Account Overview Dashboard: Pipedrive

Metrics/widgets:
- Deals won amount
- Activities performance overview
- Opportunities gained from organic traffic
- Deals leaderboard
- Deals lost by reason
8. Leads Overview Dashboard: Salesforce

Metrics/widgets:
- New leads by source
- New leads by status
- Lead owner
- Converted leads
- New cases
9. Source & Keyword Performance Dashboard: CallRail
<
Metrics/widgets:
- Sales forecast
- 1st time calls by source
- 1st time calls by keyword
- Average duration of call
- Projected opportunity by pipeline
Frequently asked questions
Turn sales insights into customer success
Dashboards give you the insights to hit sales goals, but the real win is turning that growth into long-term customer loyalty. That’s where customer service becomes the bridge between data and success.
Sales data is powerful—but it’s customer service that keeps the pipeline healthy. With Zendesk, you get an AI-powered, omnichannel solution that integrates seamlessly with your sales dashboards. AI automates repetitive tasks, routes tickets with intelligent triage, and provides a unified workspace for every channel. Empower agents, delight customers, and scale efficiently—all in one platform. Experience Zendesk’s complete customer service solution free for 14 days.
We have more information about this. Have a look below.
There’s a lot more where this came from. Keep exploring the world of sales CRM.